Press/Media: Newspaper Article
Professor Keith Lilley (Queen's University Belfast), Dr Catherine Porter (Lancaster University) & Catharine Rice (Queen's University Belfast)
A blogpost by Professor Keith Lilley (Queen's University Belfast) setting out an analytical framework for using Geographical Information Systems (GIS) as a 21st century spatial technology to explore how British trench maps of the First World War were made and used. The post is based on a paper given in Ypres on 5 November 2015 for the First World War Seminar Series organised by Gateways to the First World War and the In Flanders Fields Museum. Professor Lilley is the director of the Living Legacies 1914-18 AHRC public engagement centre.
“If the work of a general occurs in the space of an office, then the space of a battlefield ̶ physically expansive, perceptually elusive ̶ must necessarily be shrunk and flattened to the plane of a map”, Allyson Booth, Postcards from the Trenches (Oxford University Press, Oxford: 1996), 88.
The significance of the role played by maps and mapping in World War 1 cannot be underestimated. Whether small-scale geopolitical maps, or regional maps of particular sectors of combat, or larger scale detailed maps showing the disposition of gun emplacements, trench networks, and transport infrastructure, between 1914 and 1918 maps were very much a key part of the military machine of World War 1, for all those involved. There were of course also the many maps printed in newspapers of the time – with their over-scaled arrows and fronts – conveying to a war weary public, at home and abroad, the progress of battles and movements across the many fronts of this first global war.
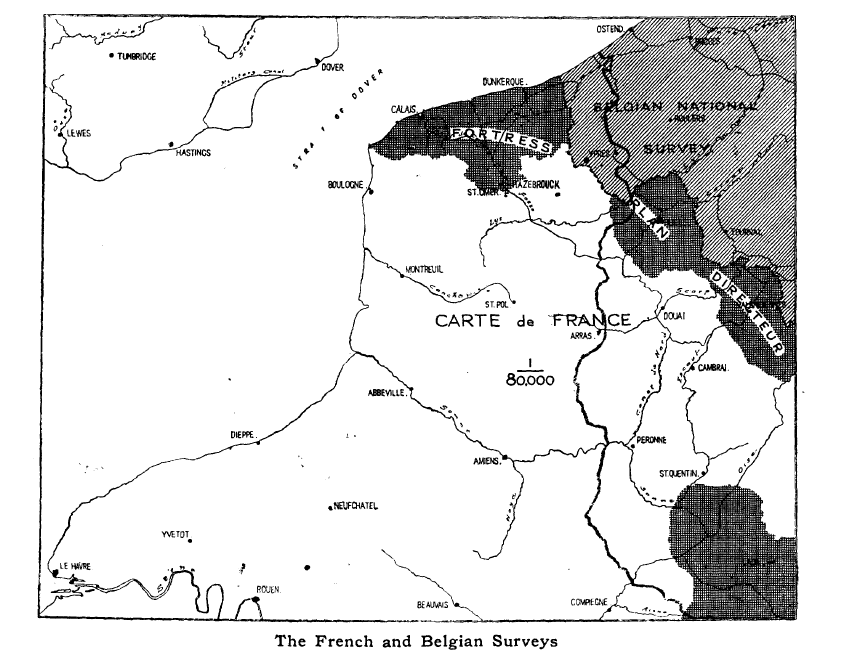
From H. S. L. Winterbotham, ‘British Survey on the Western Front’, The Geographical Journal 53 (4) (Apr., 1919), pp. 253-271, page 263
According to one estimate, the British war effort alone saw 34 million topographic maps being produced between 1914 and 1918 for use on the Western Front. The process of producing these maps, and supplying them to the front, involved not just the Geographical Section of the General Staff (GSGS) but also the Ordnance Survey, both in England as well as in northern France. Creating so many new maps at such short notice was an enormous achievement in itself, and some indication of the contemporary recognition of this is indicated by the flurry of lectures given and papers published on aspects of survey and mapping work to learned bodies and institutions immediately after the war. The focus was especially on the difficulties of surveying in the field, as well as specialist areas of survey work such as trigonometrical survey, sound ranging and photogrammetry and aerial photography.
The cartographic innovations resulting from the GSGS operations during the war have been the focus of recent academic study too, particularly on sound-ranging and aerial photography, but less so on the field-survey work involved in creating a trigonometrical network. To redress this, a group of geographers, led by Prof Keith Lilley (Queen’s University Belfast), have focused on not so much the maps themselves but on what lay behind the lines they showed, the lines, that is, that composed the geographical information captured and conveyed by large-scale topographic maps – the lines of roads, contours, tramways and canals, and of course the trenches, both of allied and opposing forces, marked out in colour, bearing the names in many cases of those who inscribed the battlefield landscape with a sense of home as well as of humour. What lay behind the lines depicted on British and allied ‘trench maps’ of World War I was the work of men on the ground, surveyors, navigating in the field of battle with their theodolites, chains and plane-tables to sight, to triangulate, and to plot.
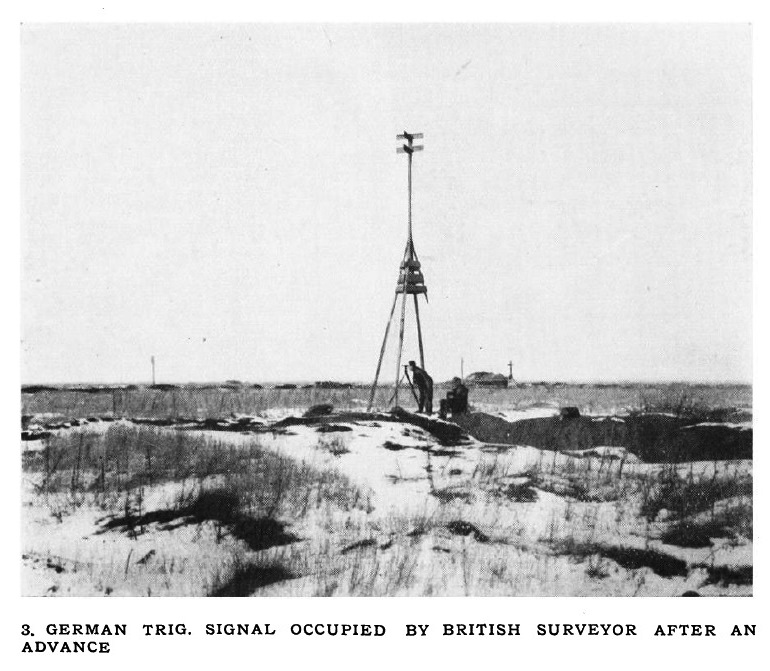
From H. S. L. Winterbotham, ‘Geographical work with the Army in France’, The Geographical Journal 53 (1) (July, 1919), pp. 12-23.
The trigonometrical networks that underpinned the large-scale ‘trench maps’, that British and allied forces used on the frontline, crucially depended on the field-surveyors’ work. To examine the geodetic accuracy of the maps that the British army made, and the effectiveness of the field-survey operations on the Western Front in 1917, twenty-first century spatial technologies can be used. To examine this, a pilot study has analysed a group of trench maps for the area of Messines (Mesen), near Ypres (Iepr), in Belgium. Analysing the map-series for one particular part of the frontline offers some otherwise unrecorded insights into the field practices of the surveyors, mainly from the Royal Engineers’ Field Survey Companies (FSCs), and reveals some of the material impacts that the battlefield had on these men and their work, their ability to navigate and survey, accurately, the mutilated landscapes of the Western Front.
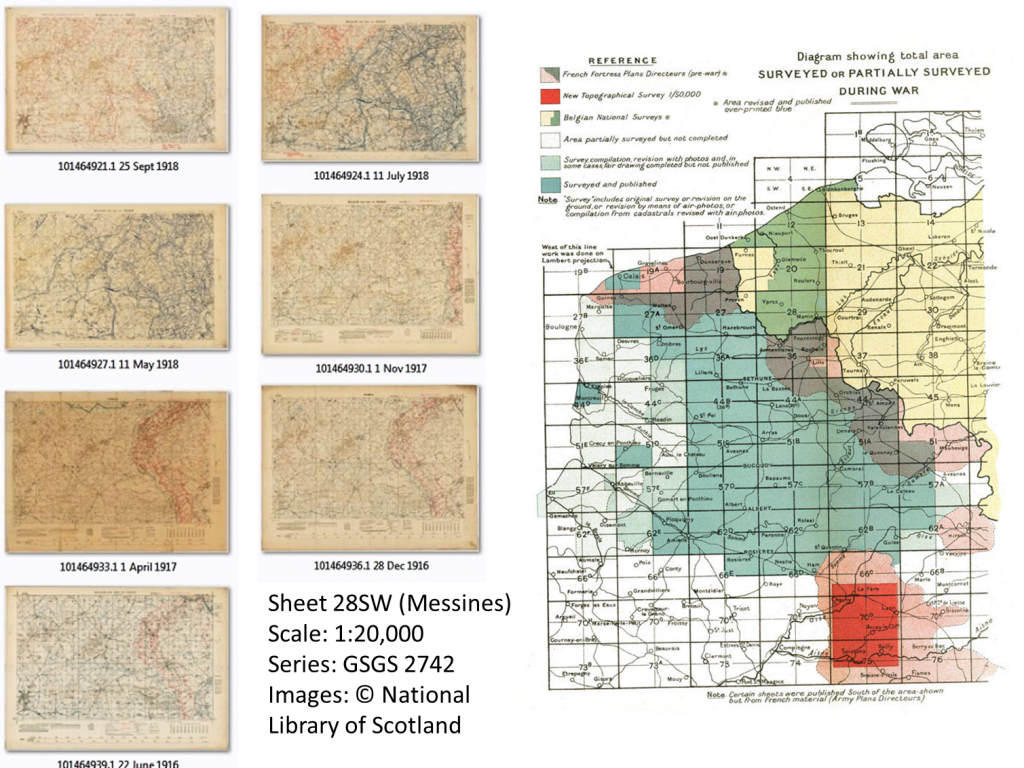
The area examined to undertake this analysis lies to the south-east of Ypres, around Messines (Mesen), namely sheet 28SW of the GSGS2742 1:20,000 series. This particular sheet was chosen because it comprised an area that lay at the intersection of two inherited trigonometrical networks, the French and Belgium pre-war geodetic networks, as well as forming an area that saw mobility of the front line during 1916-18.
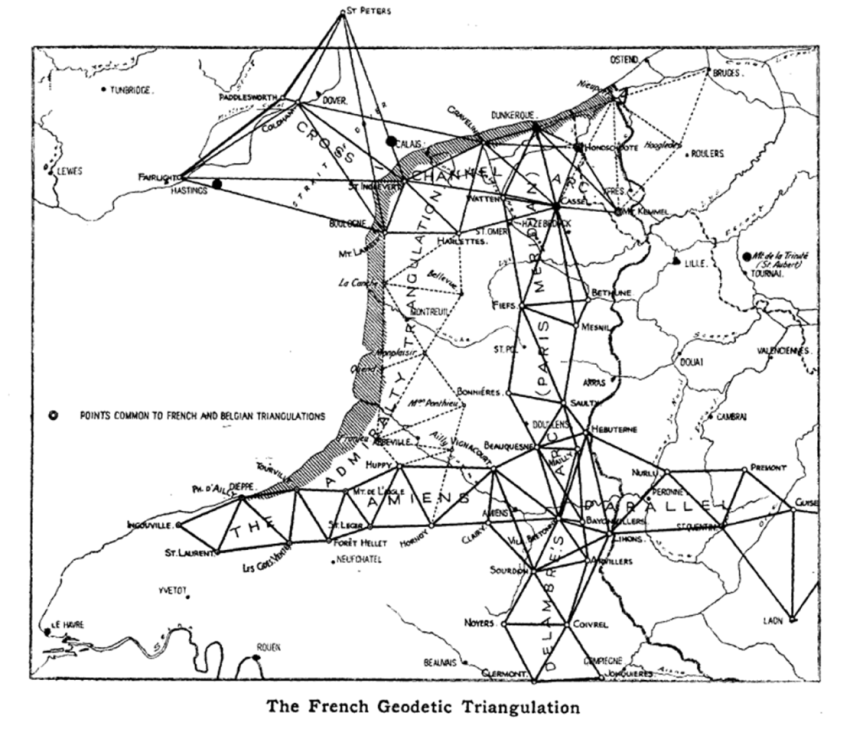
H. S. L. Winterbotham, ‘British Survey on the Western Front’, The Geographical Journal 53 (4) (Apr., 1919), pp. 253-271 at p. 259.
The approach taken to examine the accuracy of the Messines 28SW map editions was to use a Geographical Information System (ArcGIS) to digitise a series of map scans (rasters) of 28SW from the collection of the National Library of Scotland, thanks to the willingness of Chris Fleet, the library’s map curator. Each of the rasters was imported into the GIS, but the basis for analysing their cartographic accuracy used Open Source software called MapAnalyst. This calculates the relative compression or exaggeration of distances between points shown on an historic map with the same points calculated from modern geographical coordinates, which in our case were derived from those provided by Open Street Map (OSM).
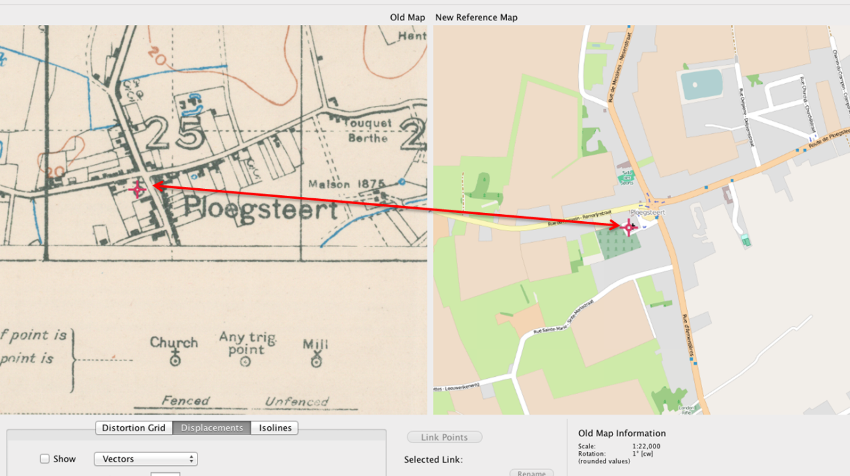
Linking historic and modern maps using Control Points in a GIS: Identifying trigonometrical stations on 1:20000 scale mapping (28SW) and their corresponding reference points on Open Street Map.
The analysis procedure involved identifying a series of trigonometrical stations marked on the map and included in a British list of stations, known as ‘List of Trigonometrical Points in Part of N E France and Belgium, arranged alphabetically by 1/20,000 sheets, Volume I’ (General Staff, General Headquarters, P17/71, 600 4/17, reproduced in Peter Chasseaud’s Artillery’s Astrologers), which were used in surveying the area and providing a trigonometrical framework for sheet 28SW.
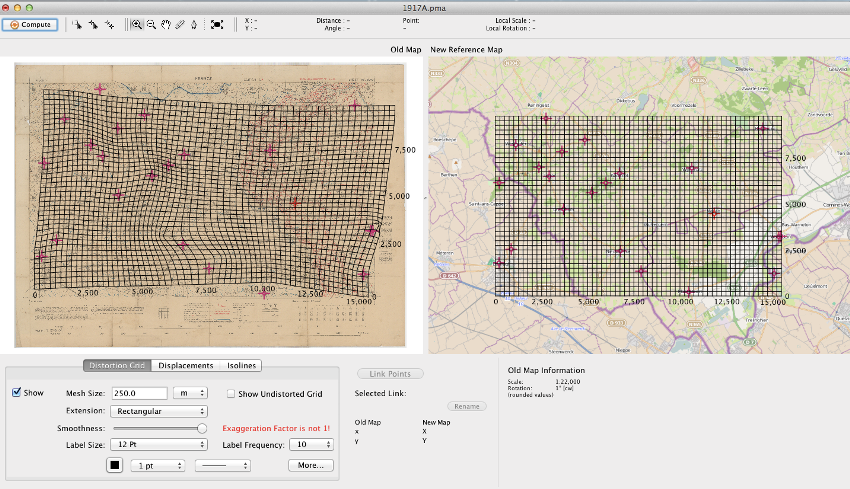
Sheet 28SW, 1 April 1917 edition: MapAnalyst distortion grid outputs, left with ‘exaggeration factor’, right without.
The results of the analyses using MapAnalyst reveals a very close match between the historic maps and modern mapping based upon common control points. This is the case for all seven revisions of sheet 28SW, between 1916 and 1918. Only when the MapAnalyst ‘exaggeration factor’ is increased are patterns of cartographic distortion seen to emerge from the ‘distortion grid’ outputs produced by the software. These outputs reveal geographical differences in levels of distortion across the map sheets, but not consistently in the same area across the seven map editions, suggesting that the MapAnalyst outputs are identifying changes over time in the underlying geodetic accuracy of the trigonometrical network used to create the maps of different survey dates for the Messines area, between 1916 and 1918. This is an interesting initial result that warrants further investigation, requiring field work today, in re-examining the locations of the trigonometrical stations used in the survey work, as well as broadening the area of the present study to cover other map sheets.
The cartographic accuracy of the maps deployed both on the frontline and behind the lines can be traced back to the survey successes in the field, in surveyors making their observations along the frontline. The maps, of 1:10,000 and 1:20,000 scale, resulting from their work, that showed the commanders and troops alike what was supposed to be there, derived from ‘spatial technologies’, innovations in surveying and map-making linking together remote sensing – aerial photographs in the latter stages of the war – with methods of ground survey. Through using Geographical Information Systems software, as well as modern geospatial data and analytical techniques, the impact the landscapes and battlefields had on the work of these surveyors, on their geodetic survey methods, and in mapping the British frontline, is revealed. Spatial technologies, then as now, expose the difficulties that were faced in mapping and navigating the Western Front.
Keith Lilley, Catherine Porter, Catharine Rice
‘Living Legacies 1914-18’, AHRC WW1 Public Engagement Centre, Queen’s University Belfast
To view the complete seminar presentation, see https://www.academia.edu/18116074/Behind_the_Lines_Frontline_Geographies...
| Period | 19/11/2015 |
|---|
Professor Keith Lilley (Queen's University Belfast), Dr Catherine Porter (Lancaster University) & Catharine Rice (Queen's University Belfast)
A blogpost by Professor Keith Lilley (Queen's University Belfast) setting out an analytical framework for using Geographical Information Systems (GIS) as a 21st century spatial technology to explore how British trench maps of the First World War were made and used. The post is based on a paper given in Ypres on 5 November 2015 for the First World War Seminar Series organised by Gateways to the First World War and the In Flanders Fields Museum. Professor Lilley is the director of the Living Legacies 1914-18 AHRC public engagement centre.
“If the work of a general occurs in the space of an office, then the space of a battlefield ̶ physically expansive, perceptually elusive ̶ must necessarily be shrunk and flattened to the plane of a map”, Allyson Booth, Postcards from the Trenches (Oxford University Press, Oxford: 1996), 88.
The significance of the role played by maps and mapping in World War 1 cannot be underestimated. Whether small-scale geopolitical maps, or regional maps of particular sectors of combat, or larger scale detailed maps showing the disposition of gun emplacements, trench networks, and transport infrastructure, between 1914 and 1918 maps were very much a key part of the military machine of World War 1, for all those involved. There were of course also the many maps printed in newspapers of the time – with their over-scaled arrows and fronts – conveying to a war weary public, at home and abroad, the progress of battles and movements across the many fronts of this first global war.
From H. S. L. Winterbotham, ‘British Survey on the Western Front’, The Geographical Journal 53 (4) (Apr., 1919), pp. 253-271, page 263
According to one estimate, the British war effort alone saw 34 million topographic maps being produced between 1914 and 1918 for use on the Western Front. The process of producing these maps, and supplying them to the front, involved not just the Geographical Section of the General Staff (GSGS) but also the Ordnance Survey, both in England as well as in northern France. Creating so many new maps at such short notice was an enormous achievement in itself, and some indication of the contemporary recognition of this is indicated by the flurry of lectures given and papers published on aspects of survey and mapping work to learned bodies and institutions immediately after the war. The focus was especially on the difficulties of surveying in the field, as well as specialist areas of survey work such as trigonometrical survey, sound ranging and photogrammetry and aerial photography.
The cartographic innovations resulting from the GSGS operations during the war have been the focus of recent academic study too, particularly on sound-ranging and aerial photography, but less so on the field-survey work involved in creating a trigonometrical network. To redress this, a group of geographers, led by Prof Keith Lilley (Queen’s University Belfast), have focused on not so much the maps themselves but on what lay behind the lines they showed, the lines, that is, that composed the geographical information captured and conveyed by large-scale topographic maps – the lines of roads, contours, tramways and canals, and of course the trenches, both of allied and opposing forces, marked out in colour, bearing the names in many cases of those who inscribed the battlefield landscape with a sense of home as well as of humour. What lay behind the lines depicted on British and allied ‘trench maps’ of World War I was the work of men on the ground, surveyors, navigating in the field of battle with their theodolites, chains and plane-tables to sight, to triangulate, and to plot.
From H. S. L. Winterbotham, ‘Geographical work with the Army in France’, The Geographical Journal 53 (1) (July, 1919), pp. 12-23.
The trigonometrical networks that underpinned the large-scale ‘trench maps’, that British and allied forces used on the frontline, crucially depended on the field-surveyors’ work. To examine the geodetic accuracy of the maps that the British army made, and the effectiveness of the field-survey operations on the Western Front in 1917, twenty-first century spatial technologies can be used. To examine this, a pilot study has analysed a group of trench maps for the area of Messines (Mesen), near Ypres (Iepr), in Belgium. Analysing the map-series for one particular part of the frontline offers some otherwise unrecorded insights into the field practices of the surveyors, mainly from the Royal Engineers’ Field Survey Companies (FSCs), and reveals some of the material impacts that the battlefield had on these men and their work, their ability to navigate and survey, accurately, the mutilated landscapes of the Western Front.
The area examined to undertake this analysis lies to the south-east of Ypres, around Messines (Mesen), namely sheet 28SW of the GSGS2742 1:20,000 series. This particular sheet was chosen because it comprised an area that lay at the intersection of two inherited trigonometrical networks, the French and Belgium pre-war geodetic networks, as well as forming an area that saw mobility of the front line during 1916-18.
H. S. L. Winterbotham, ‘British Survey on the Western Front’, The Geographical Journal 53 (4) (Apr., 1919), pp. 253-271 at p. 259.
The approach taken to examine the accuracy of the Messines 28SW map editions was to use a Geographical Information System (ArcGIS) to digitise a series of map scans (rasters) of 28SW from the collection of the National Library of Scotland, thanks to the willingness of Chris Fleet, the library’s map curator. Each of the rasters was imported into the GIS, but the basis for analysing their cartographic accuracy used Open Source software called MapAnalyst. This calculates the relative compression or exaggeration of distances between points shown on an historic map with the same points calculated from modern geographical coordinates, which in our case were derived from those provided by Open Street Map (OSM).
Linking historic and modern maps using Control Points in a GIS: Identifying trigonometrical stations on 1:20000 scale mapping (28SW) and their corresponding reference points on Open Street Map.
The analysis procedure involved identifying a series of trigonometrical stations marked on the map and included in a British list of stations, known as ‘List of Trigonometrical Points in Part of N E France and Belgium, arranged alphabetically by 1/20,000 sheets, Volume I’ (General Staff, General Headquarters, P17/71, 600 4/17, reproduced in Peter Chasseaud’s Artillery’s Astrologers), which were used in surveying the area and providing a trigonometrical framework for sheet 28SW.
Sheet 28SW, 1 April 1917 edition: MapAnalyst distortion grid outputs, left with ‘exaggeration factor’, right without.
The results of the analyses using MapAnalyst reveals a very close match between the historic maps and modern mapping based upon common control points. This is the case for all seven revisions of sheet 28SW, between 1916 and 1918. Only when the MapAnalyst ‘exaggeration factor’ is increased are patterns of cartographic distortion seen to emerge from the ‘distortion grid’ outputs produced by the software. These outputs reveal geographical differences in levels of distortion across the map sheets, but not consistently in the same area across the seven map editions, suggesting that the MapAnalyst outputs are identifying changes over time in the underlying geodetic accuracy of the trigonometrical network used to create the maps of different survey dates for the Messines area, between 1916 and 1918. This is an interesting initial result that warrants further investigation, requiring field work today, in re-examining the locations of the trigonometrical stations used in the survey work, as well as broadening the area of the present study to cover other map sheets.
The cartographic accuracy of the maps deployed both on the frontline and behind the lines can be traced back to the survey successes in the field, in surveyors making their observations along the frontline. The maps, of 1:10,000 and 1:20,000 scale, resulting from their work, that showed the commanders and troops alike what was supposed to be there, derived from ‘spatial technologies’, innovations in surveying and map-making linking together remote sensing – aerial photographs in the latter stages of the war – with methods of ground survey. Through using Geographical Information Systems software, as well as modern geospatial data and analytical techniques, the impact the landscapes and battlefields had on the work of these surveyors, on their geodetic survey methods, and in mapping the British frontline, is revealed. Spatial technologies, then as now, expose the difficulties that were faced in mapping and navigating the Western Front.
Keith Lilley, Catherine Porter, Catharine Rice
‘Living Legacies 1914-18’, AHRC WW1 Public Engagement Centre, Queen’s University Belfast
To view the complete seminar presentation, see https://www.academia.edu/18116074/Behind_the_Lines_Frontline_Geographies...
| Title | Behind the lines – mapping and navigating Western Front landscapes through spatial technologies |
|---|---|
| Date | 19/11/15 |
| Persons | Catherine Porter |